Applications – PQ

Power Quality Applications

All over the Power Grid

Alt Text

Supraharmonics

Beyond the 50th Harmonic. Complete Spectrum Analysis.

Supraharmonic Analysis Fundamentals

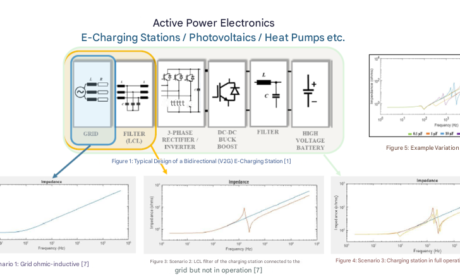
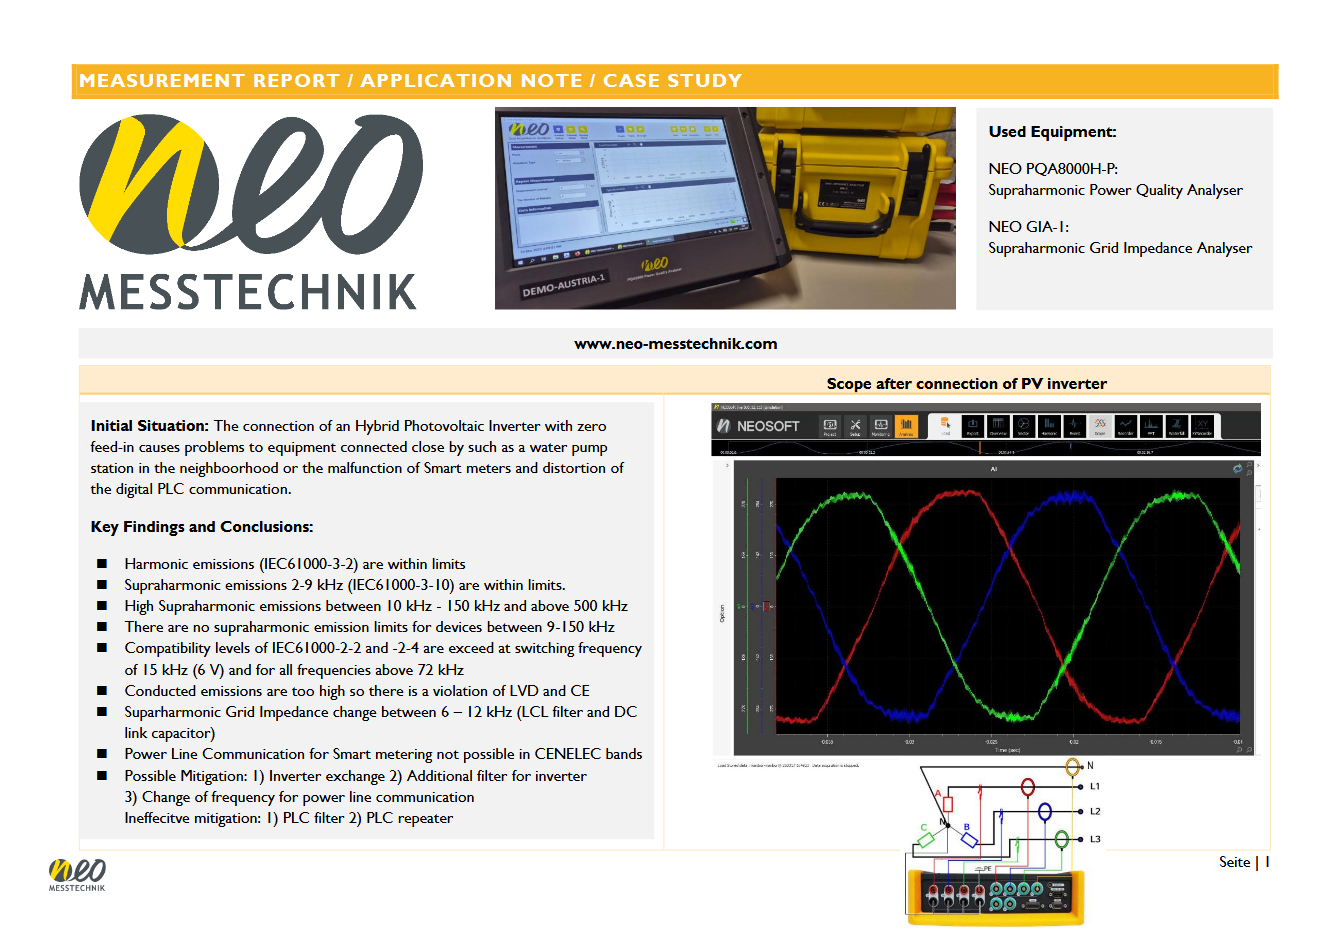
Power quality analysis stopping at the 50th harmonic misses the frequency range where 80% of future electrical loads will operate. Modern power electronics generate emissions from 2 kHz to 500 kHz that cause equipment malfunctions, communication failures, and EMC violations.

Engineering teams need measurement tools that address the full spectrum of power quality issues in modern electrical systems. Traditional analyzers cannot capture supraharmonic phenomena like frequency beating, intermodulation effects, or sub-cycle impedance variations that affect system performance.

This comprehensive application note covers supraharmonic measurement techniques for modern power systems. Real examples include EV charging interruptions, smart meter failures, coffee machine malfunctions, and LED driver disturbances – all traced to supraharmonic emissions.

Discover measurement methodologies for wideband vs. narrowband emissions, frequency intermodulation analysis, and envelope triggering for transient capture. The note explains why simulation approaches fail and demonstrates field measurement techniques that reveal hidden power quality issues.

V2G Charging Impact on Grid Impedance up to 150 kHz

Electric vehicle charging stations with bidirectional power flow create unexpected grid impedance changes that extend far beyond traditional harmonic analysis. V2G systems use high-frequency switching for efficient conversion, but their LCL input filters and DC link capacitors introduce resonance behaviors across the 2-150 kHz supraharmonic spectrum.

Even disconnected V2G chargers alter grid impedance through passive components. LCL filter capacitors affect resonance between 10-50 kHz, while DC link capacitors influence lower frequencies, transforming stations into supraharmonic sinks even when not operating.

This research documents Matlab Simulink analysis combined with laboratory measurements on reconstructed distribution networks. University studies reveal how V2G connections create parallel and series resonance points affecting equipment heating and PLC communication systems.

See measurement methodology using 1 MS/s sampling across multiple channels. The study includes impedance analysis showing resonance patterns, sensitivity analysis of passive components, and why conventional grid modeling fails to predict V2G interaction effects.

Featured Image

The effects of active power electronics on the higher frequency grid impedance up to 150 kHz

  • Posted by Neo Messtechnik
  • On 10. July 2025

Bernhard Grasel, Jose Baptista, Manfred TragnerUniversity of Applied Sciences Technikum Vienna, University of Vila Real Portugal, NEO Messtechnik GmbH...

  • Active Power Electronics – High Frequency Grid Impedance, Analysis, Measurement

Generation Plant Harmonic Measurement Beyond 9 kHz

Renewable energy converters use switching frequencies creating emissions beyond 9 kHz measurement requirements. Wind turbines switch at 2-4 kHz while PV systems operate 4-20 kHz, generating sidebands that remain invisible to standard compliance testing.

Technical guidelines specify emission limits to 9 kHz, but switching frequency multiples create interference extending to 150 kHz. Current sensors with verified higher frequency accuracy reveal emission content that explains grid compatibility problems.

This application note presents measurement approaches for generation plant harmonic assessment using high-precision fluxgate current sensors. Field measurements reveal complete emission spectra including sub-50 Hz and supraharmonic content simultaneously.

Discover measurement requirements for power quality analyzers with 300+ kHz sampling and superior signal-to-noise ratios. The note includes sensor selection criteria, calibration approaches, and measurement examples showing emission detection beyond standard requirements.

Featured Image

Current harmonic measurement at the grid connection point of the power generation plant

  • Posted by Neo Messtechnik
  • On 2. May 2023

In Germany, the respective technical rules for the connection of customer installations to the low-, medium-, high- and extra-high-voltage...

150 kHz Medium Voltage

Advanced Sensors. Extended Frequency Range.

Power Quality Measurements up to 150 kHz

Current power quality standards create a measurement gap between traditional harmonic analysis (up to 2.5 kHz) and EMC requirements (starting at 150 kHz). This gap covers the critical frequency range where modern power electronics operate, generating emissions that can violate IEC 61000-2-2 compatibility levels.

Utility engineers need measurement capabilities that extend beyond the 50th harmonic to assess grid compatibility of renewable energy systems, EV charging infrastructure, and industrial drives. Without this capability, compliance assessment remains incomplete and potential interference issues go undetected.

This technical article demonstrates measurement techniques for the 2-150 kHz frequency range using mobile power quality analyzers. Learn how frequency-controlled voltage transformers and RC dividers enable medium voltage measurements up to 150 kHz bandwidth.

The article includes practical guidance for switchable voltage inputs (600V peak and 10V peak) to accommodate different sensor types. See actual measurement examples showing violation detection at switching frequencies and comparison with IEC 61000-2-2 limits across utility voltage levels.

Utility Voltage Measurements up to 150 kHz

Power quality measurements in medium voltage face fundamental limitations when voltage transformers encounter frequencies above 2 kHz. Testing shows 10 kV transformers maintain accuracy only to 5 kHz before resonance creates 100% measurement errors.

IEC 61000-2-2 defines compatibility levels to 150 kHz, yet utilities cannot verify compliance using existing infrastructure. Frequency-optimized RC divider sensors enable 150 kHz measurement but require specialized analyzers with switchable inputs for different signal levels.

This technical article demonstrates measurement solutions for utility voltage levels using frequency-optimized sensors and mobile power quality analyzers. Real measurements show compatibility level violations at switching frequencies across MV systems.

Explore switchable voltage input technology (600V peak and 10V peak) accommodating different sensor types. The article includes sensor selection guidance, measurement setup procedures, and actual utility measurement examples with IEC limit comparisons.

Grid Impedance

Mobile Measurement. Field-Ready Solutions.

Mobile Grid Impedance Measurement up to 420 kHz

Grid impedance measurement has been limited to laboratory environments, leaving field engineers unable to investigate power quality problems with modern electronic equipment. Traditional analysis cannot predict how power electronics reshape impedance characteristics in the 10-150 kHz range where interference occurs.

The world’s first mobile grid impedance analyzer enables field measurements up to 420 kHz. Unlike harmonic-range impedance dominated by transformers, impedance from 10-150 kHz depends on high-power electronic equipment including PV systems and EV charging stations.

This application note demonstrates the GIA3 measurement system combining three-phase impedance analysis with supraharmonic power quality measurement. Field studies show how equipment creates resonance conditions that amplify emissions into problematic interference.

Learn measurement techniques using natural grid transients without external excitation. The methodology includes impedance extraction algorithms, resonance detection methods, and case studies showing parallel/series resonance identification in distribution systems.

Featured Image

Impact of Electrical Equipment on Frequency-Dependent Grid Impedance up to 150 kHz

  • Posted by Harald
  • On 18. February 2025

Direct current charging stations for electric vehicles or photovoltaic inverters or heat pumps use active power electronics to convert...

  • GIA, Grid Impedance Analyser, NEW DEVICE, Power Grid, Research, Supraharmonics

Non-invasive measurement of grid impedances for the assessment of grid perturbations

Grid impedance measurement traditionally requires invasive procedures that disrupt operations, yet frequency-dependent impedance knowledge becomes essential as power electronics reshape grid behavior. Conventional modeling cannot predict impedance variations from modern electronic loads and distributed generation.

The breakthrough methodology extracts impedance from naturally occurring transients without external excitation. Load switching and equipment connection events provide measurement opportunities using advanced signal processing of high-resolution waveforms.

This application note documents the non-invasive measurement approach with field validation case studies. A water pumping station investigation revealed how stub line configuration created resonance amplifying emissions into residential interference.

Learn measurement techniques using transient event detection and impedance calculation algorithms. The methodology includes signal processing requirements, automatic event recognition, and field measurement examples showing resonance identification without grid disruption.

D-A-CH-CZ Edition 3 Compliance Assessment

Grid connection requirements across Germany, Austria, Czech Republic, and Slovakia emphasize frequency-dependent impedance assessment and resonance calculations beyond simple emission compliance. Edition 3 rules require comprehensive equipment-grid interaction analysis.

Compliance methodology must evaluate emissions and characterize impedance to assess resonance conditions. Traditional emission-only approaches cannot capture dynamic interactions determining actual system behavior under varying conditions.

This application note presents integrated measurement combining supraharmonic analysis with impedance assessment for automated D-A-CH-CZ compliance evaluation. The workflow processes measurement data through analysis tools generating regulatory documentation.

Learn measurement system requirements and automated analysis capabilities. The note includes CSV processing workflows, resonance factor calculations, and PDF report generation meeting D-A-CH-CZ submission requirements for streamlined approval processes.

Smart Meter PLC

Communication Failures. Root Cause Analysis.

PV Inverter Interference: When Smart Meters Fail

Smart meter deployments face unexpected field failures that don’t appear in laboratory testing. Meters that pass IEC 62052/62053 acceptance tests experience measurement drift, communication dropouts, and complete failures when installed in real grid environments with power electronic loads.

The root cause often lies in supraharmonic emissions from modern equipment that create electromagnetic interference beyond the 2 kHz measurement range of conventional test equipment. Grid-connected inverters, EV chargers, and LED drivers generate conducted emissions that interfere with meter accuracy and PLC communication systems.

This case study documents how a zero-feed-in PV inverter caused complete smart meter failure and affected neighboring water pump stations. The investigation reveals emissions at 15 kHz switching frequency reaching 6V – exceeding IEC 61000-2-2 compatibility levels.

See the complete measurement methodology using 1 MS/s sampling to capture emissions up to 150 kHz. The report includes 3D FFT analysis showing emission patterns before and after connection, grid impedance changes between 6-12 kHz, and why conventional mitigation strategies failed while targeted solutions succeeded.

Smart Meter Communication Failures: When PLC Goes Silent

Smart meter communication failures often correlate with supraharmonic interference in CENELEC frequency bands (3-95 kHz). G3-PLC systems require minimum signal-to-noise ratios that can be compromised by power electronic equipment operating in overlapping frequency ranges.

The challenge extends beyond simple signal attenuation. Switching frequencies that align with OFDM subcarriers create interference patterns that render PLC communication unreliable, forcing expensive manual meter reading and undermining smart grid investments.

This application note reveals how smart meter rollouts exposed PLC vulnerability to supraharmonic interference. A documented case shows how 10 dBµV signal dampening between transmitter and receiver equals complete data packet loss.

Learn the integrated measurement approach combining 500 kHz spectrum analysis, encrypted PLC data stream capture, and grid impedance analysis. The note demonstrates why voltage-only measurements miss critical interference sources and how multi-channel current measurement enables rapid troubleshooting in complex installations.

EV Charging

Comprehensive Analysis. Multi-Domain Troubleshooting.

Unbalance of Single-Phase Charging Stations

Single-phase EV charging creates grid unbalance that exceeds EN 50160 limits when charging currents approach 20A or higher. The resulting negative sequence voltages and neutral currents can trigger protection systems and affect voltage regulation for other customers.

The problem intensifies as EV adoption grows and charging power increases. Three-phase chargers can also contribute to unbalance when they operate in two-phase mode or use unbalanced charging strategies during different battery states.

This application note documents a field measurement where 23A single-phase charging caused undervoltage in Zöbern, Austria. The loaded phase dropped to 207V (10% voltage drop limit), forcing charger shutdown.

See how real-time unbalance monitoring captured the relationship between charging current and voltage drop across all phases. Learn measurement techniques for documenting temporary unbalanced conditions and neutral current flow that conventional power quality analysis overlooks.

Featured Image

Unbalance of single-phase charging stations

  • Posted by Harald
  • On 15. July 2024

If an electric vehicle is charged at home some chargers operate in single phase mode.Some charging stations allow single-phase...

  • electric vehicle, single phase charging, Unbalance

Electric Vehicle Charging Station: Efficiency and Interference Analysis

EV charging station troubleshooting requires analysis across multiple domains: AC power quality, DC charging parameters, control signal integrity, and electromagnetic compatibility. Problems can originate from grid conditions, charger electronics, vehicle systems, or electromagnetic interference from nearby equipment.

Conventional power quality analyzers cannot address the full scope of charging system analysis. Engineers need measurement capabilities that cover supraharmonic emissions, CP/PP signal analysis, efficiency measurement, and communication protocol verification in a single diagnostic approach.

This application note presents comprehensive EV charging station analysis methodology covering power quality, efficiency, and communication systems. Case studies include charging interruptions caused by supraharmonic emissions at 20-40 kHz switching frequencies.

Explore measurement techniques for CP signal PWM analysis, CAN bus protocol monitoring, and simultaneous AC/DC power measurement for efficiency calculation. The note demonstrates multi-channel synchronized measurements that reveal interactions between charging operations and grid stability.

Our Flagship Products

Media

All-In-One. 1MS/s. Multi-Touch. 4 hours mobile operation. The reference instrument on the market.

Media

The world’s best mobile PV inspection instrument. Simultaneous IV curve measurement of up to 20 strings

Media

Grid impedance analyzer for detection of resonances, connection evaluation and PLC (Power Line Communication)

Photovoltaic Applications

Photovoltaic systems promise decades of maintenance-free operation, yet hidden electrical faults silently erode performance and threaten safety. Discover how advanced IV curve analysis reveals mounting shadows, connector failures, and mismatch amplification effects—exposing the technical reality behind underperforming solar installations that thermal imaging cannot detect.

More Applications with NEO Messtechnik

NEO PQ Analysers and Monitors are instruments for reliable measurements, conclusive report generation and thereby ensuring grid stability. According to the EN 50160 we would classify the following signals or values as classic PQ parameters: Power and Energy, Voltage Variations, Harmonics, Unbalance, Flicker, among others.

Harmonics in the grid heavily influence waveforms as well as the operation and life span of electrical equipment. By using NEO instruments with high sampling rate and bandwidth you easily detect all emerging Harmonics, Interharmonics, THD and Supraharmonics up to 150kHz. Sensor calibration over the whole whole frequency range ensures the highest accurate results – also at high frequencies. This enables a precision of 0.05% for the 50th Harmonic.

Alt Text

NEO Messtechnik solutions are especially powerful when it comes to the increasing demand of Higher Frequency and Supraharmonics analysis. For more information simply click on the button below.

Alt Text

IEEE 519 and Harmonics

Read about the standard and all the information you need in our Multipart-Series PQ-Explained.

Flicker is a visible change in lamp brightness due to rapid fluctuations/voltage changes. The NEO Messtechnik instruments calculate the short-term, long-term flicker exposure as well as the instantaneous flicker (PST, PLT, Pinst).

A multitude of trigger options allows to detect any kind of waveform deviation from the ideal pure sine wave. The trigger options include trigger on input signals (voltage, current), calculated parameters (P,Q,S, THD, x-th Harmonic etc.) and dynamic signal analysis (1/2 Period values, Phase angle Jumps, RoCoF, Envelope trigger). Furthermore, it is possible to combine multiple triggers.

Evaluation according to national and international standards:
Grid: EN50160, IEC61000-2-2/-4/-12, IEEE 1159, IEEE 519, NRS048

Renewable: FGW-TR3, IEC61400-21, IEC61400-12, BDEW, TOR

Motor, Transformer: IEC 60076-1 / IEC60034

Equipment: IEC 61000-3-2 /-12  and IEC 61000-3-3 /-11

Already a small voltage unbalance (2%) can increase the winding temperature of electrical equipment heavily. Further consequences are reduced lifetime, malfunction, increased energy consumption, among others.

The NEO Messtechnik instruments determine the Unbalance for fundamental or total spectrum as well as the symmetrical components for 10-period values or simple period-values.

The calculated positive, negative and zero-sequence systems are available for voltage, current, active and reactive power. These are major evaluation parameters of Distributed energy sources (DER). Photovoltaic or Wind Power plants need to fulfil the requirements of FGW-TR3, IEC61400-21 and other grid codes in order to be connected to the power grid.

Alt Text

Symmetrical components

Learn about positive, negative and zero-sequence of 3-phase systems in our NEO-Blog.

  • Grid Impedance Measurement (Z, phi, Re, Im, R, X / Zero-, Postivie- Negative Sequence)
  • Fundamental Frequency Impedance (50Hz / 60Hz /…)
  • Grid Impedance up to 10 kHz (Higher Frequencies)
  • Grid Impedance up to 150 kHz (Supraharmonics)
  • Interaction Inverter
  • AC Power
  • DC Power
  • Efficiency
  • Power Quality according to IEC61400 and FGW-TR3
  • Switching Operations and Grid connection
  • U-I curve respective Power Performance curve

Meter input modules can be combined in a way of measuring one 3-phase voltage and multiple 3-phase current systems. The intention of such meter is typically to monitor the distribution transformer powering multiple output feeders. Functionality of multi-feeder-monitor is similar to PQ meter, with possibility to measure up to 10x  3-phase feeders in total. Multi  feeder monitor also provides detailed information about power and energy consumption of each feeder.

Alt Text

New applications like Microgrids, Distributed generation (DER), Distributed Control will bring higher dynamics and wider range of interactions.

During connection & reconnection of Microgrids and DER an increased number of Phase Angle jumps, frequency variations (RoCoF), voltage dips/swells and switching transients will appear.

Increasing number of inverters & power electronics will increase significance of Grid Impedance measurements,  Resonances and oscillations measurements and analysis.

One main focus of NEO Messtechnik products is to investigate System dynamics and help to design a stable grid – as much as possible. The instrument measures all kind of sytem dynamics with highest available quality.

Alt Text

Highest Precision Synchrophasor Measurement

PMU – The Phasor Measurement Unit is a device for accurate synchrophasor measurements. The measurement results are used for the online detection of the electrical grid status. This principle is based on comparing the phase angles of the fundamental harmonic measured at different points of the distribution or transmission network using several devices at synchronized points in time.
High-Accurate GPS Receiver
The meter has to be equipped by the internal/external GPS for receiving synchronous timestamps.

Additional Sensor and Range calibration
The additional sensor and measurement range calibration (see chapter PQA8000 calibration) allows for highly accurate measurement results.
IEEE C37.118
The PMU firmware measures voltage and current phasors, frequency, and calculates the positive symmetrical components of voltages and currents. The measured data is sent to the superior system according to the IEEE C37.118 communication protocol. By default, the device fully complies with the requirements of IEEE C37.118, which defines the PMU accuracy in stabilized state and a communication protocol for real-time phasor transmission.

The PQA 8000 instrument offers a built-in GPS receiver together with highly-accurate voltage inputs and
– Total Vector Error 0.01% (typ.)
– Angle Accuracy 0.003° (typ.)

Alt Text

Rate of change of frequency RoCoF is the time derivative of the power system frequency (df/dt). Large df/dt values may endanger secure system operation. RoCoF measurements are becoming more important to system operators as the number of distributed energy resources (DER) increases.

NEO Messtechnik offers highest precision RoCoF measurement instruments. The extremely low noise floor of the amplifiers together with a smart measurement algorithmn, which reflects influences like Harmonics, Interharmonics, Flicker, etc., allows highest accurate measurements with very low latency.

Alt Text

Phasor angle differences between various parts of the transmission grid are an indicator of grid health and can provide early warning in the case of developing power system disturbances that can lead to grid separation known as islanding, or even blackout. The accurate measurement of the phasor angles across the grid is made possible by the use of GPS-synchronized phasor-sampling clocks. Nationwide networks of time-synchronized phasor measurement units (PMUs) are called Wide Area Monitoring Systems (WAMS).

The main features of the WAMS systems are the visualization and monitoring of phasors , islanding detection, resynchronization and black start detection, oscillations detection, stability and voltage monitoring. The results can also be passed to SCADA or other systems.

Alt Text

The number of AC to DC and DC to AC conversions in the power landscape is steadily increasing. More and more loads and energy generation units are connected via power electronic interfaces (inverters) to the grid. The number of batteries is increasing and DC power is also used for long-distance power transfer (HVDC). The measurement of AC and DC parts of the voltage and current signals is getting mandatory.

  • Short Circuit Tests 16,7Hz / 15kV Railway Grid
  • Disturbance & Transient Record Transmission & Distribution Grid
  • Transformer and HVDC Efficiency Measurement (230V to 400kV)
  • Interferecence Current Measurement
  • Inductive Coupling Detection
  • System Dynamics ROCOF / PMU
  • Power Quality
  • Short-Circuit Tests
  • Power Quality Testing
  • Harmonics & THD
  • Transient Recording
  • Troubleshooting
  • Pantograph and Current Shoe Testing (Railway)

Using best available technology on market for highest precision measurement results.

  • EV Charging Stations
  • Motor
  • Generator
  • Inverter
  • Transformer
  • HVDC
  • Any type of Electrical Equipment

The spreading analysis of Power Quality parameters is done for electrical equipment which is used in high amount or with high power. Examples are multiple Electric Vehicle (EV) Charging stations or heatpumps.

Mitigation of some Power Quality parameters very often increases the penetration of other Power Quality parameters. Typical example is using higher switching frequencies of inverters while reducing lower number harmonics often increases emission at higher frequencies.

This types of analysis require synchronous measurements of multipe input channels and instruments. The NEO Messtechnik instruments can be synchronised directly or via GPS with highest time precision.

Alt Text
English
Cookie Consent with Real Cookie Banner