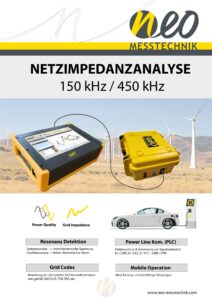

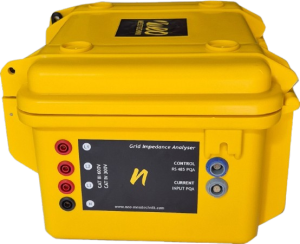
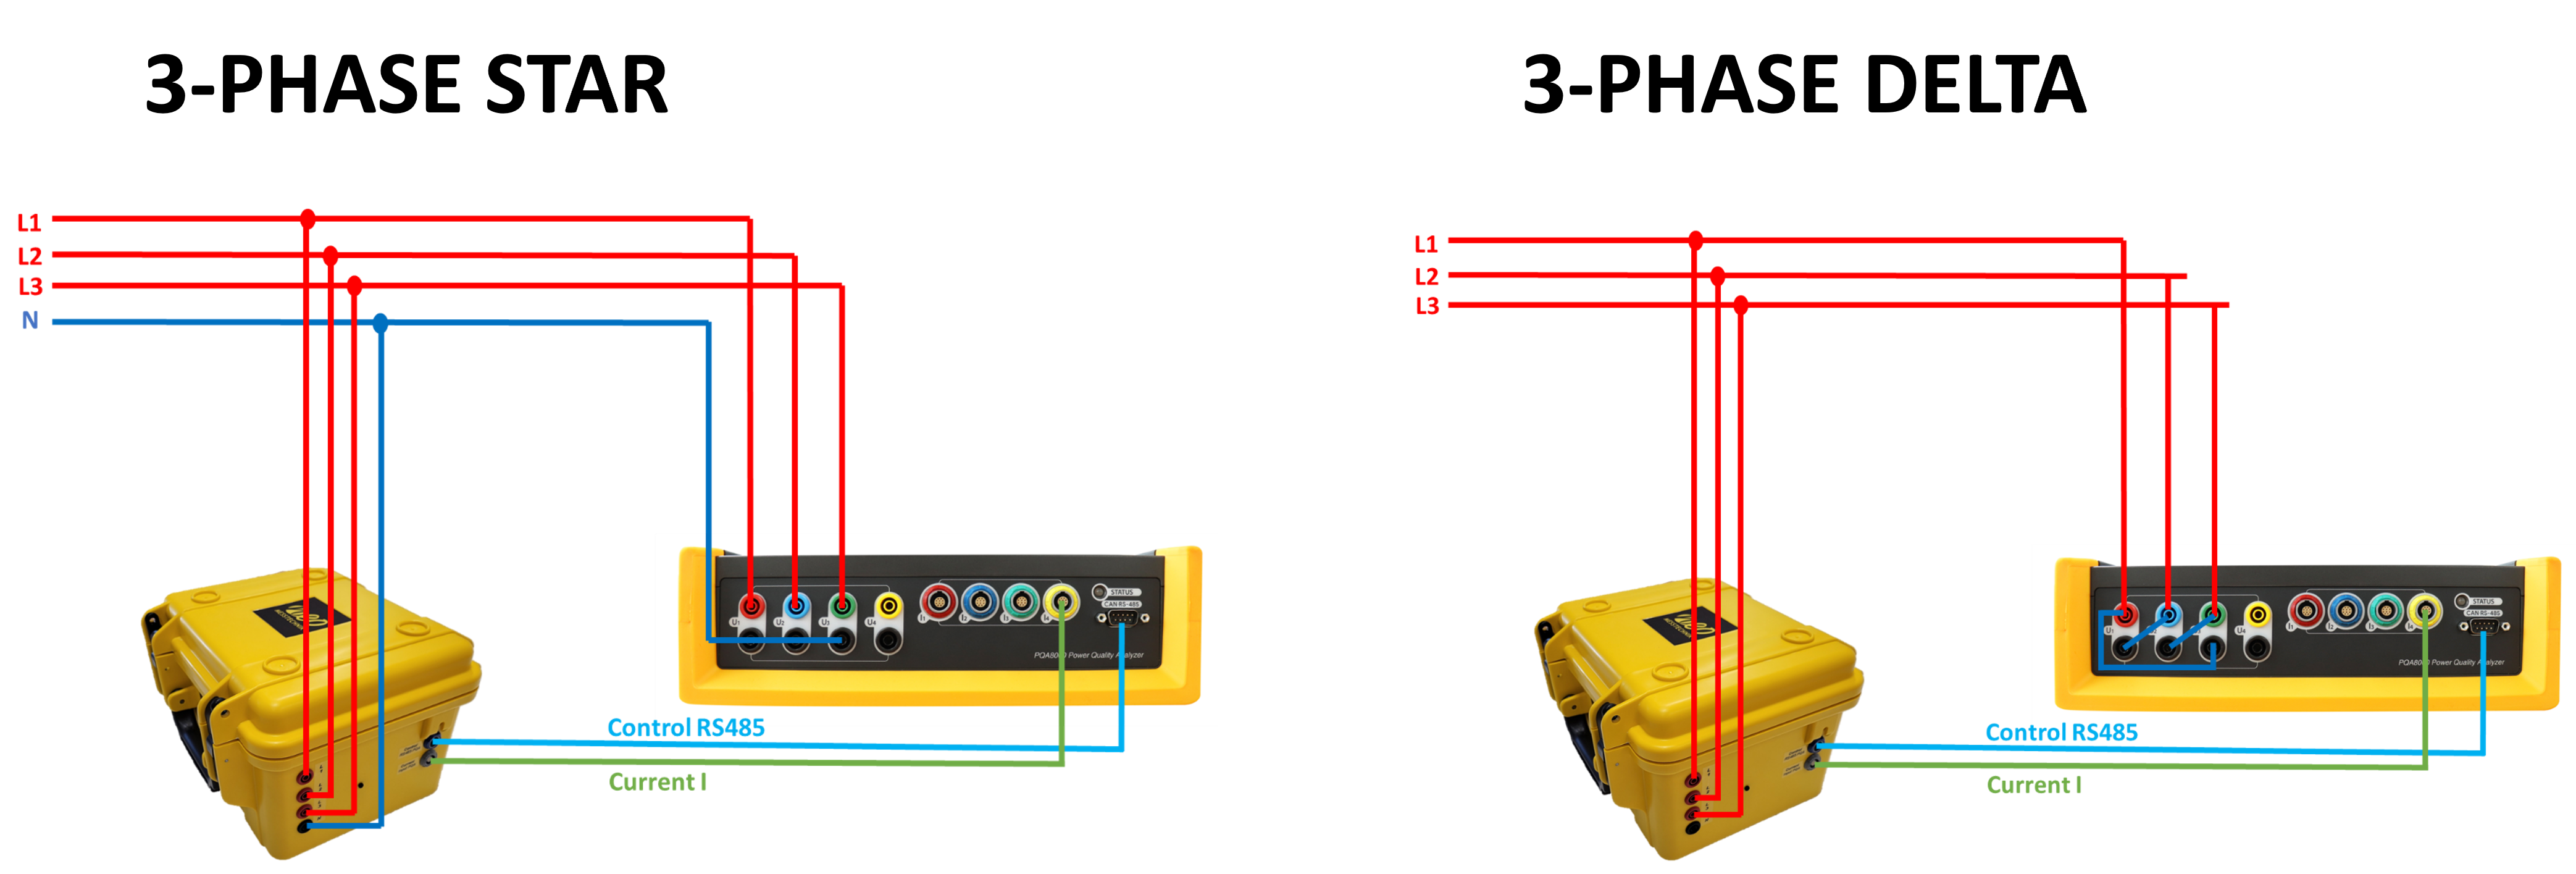
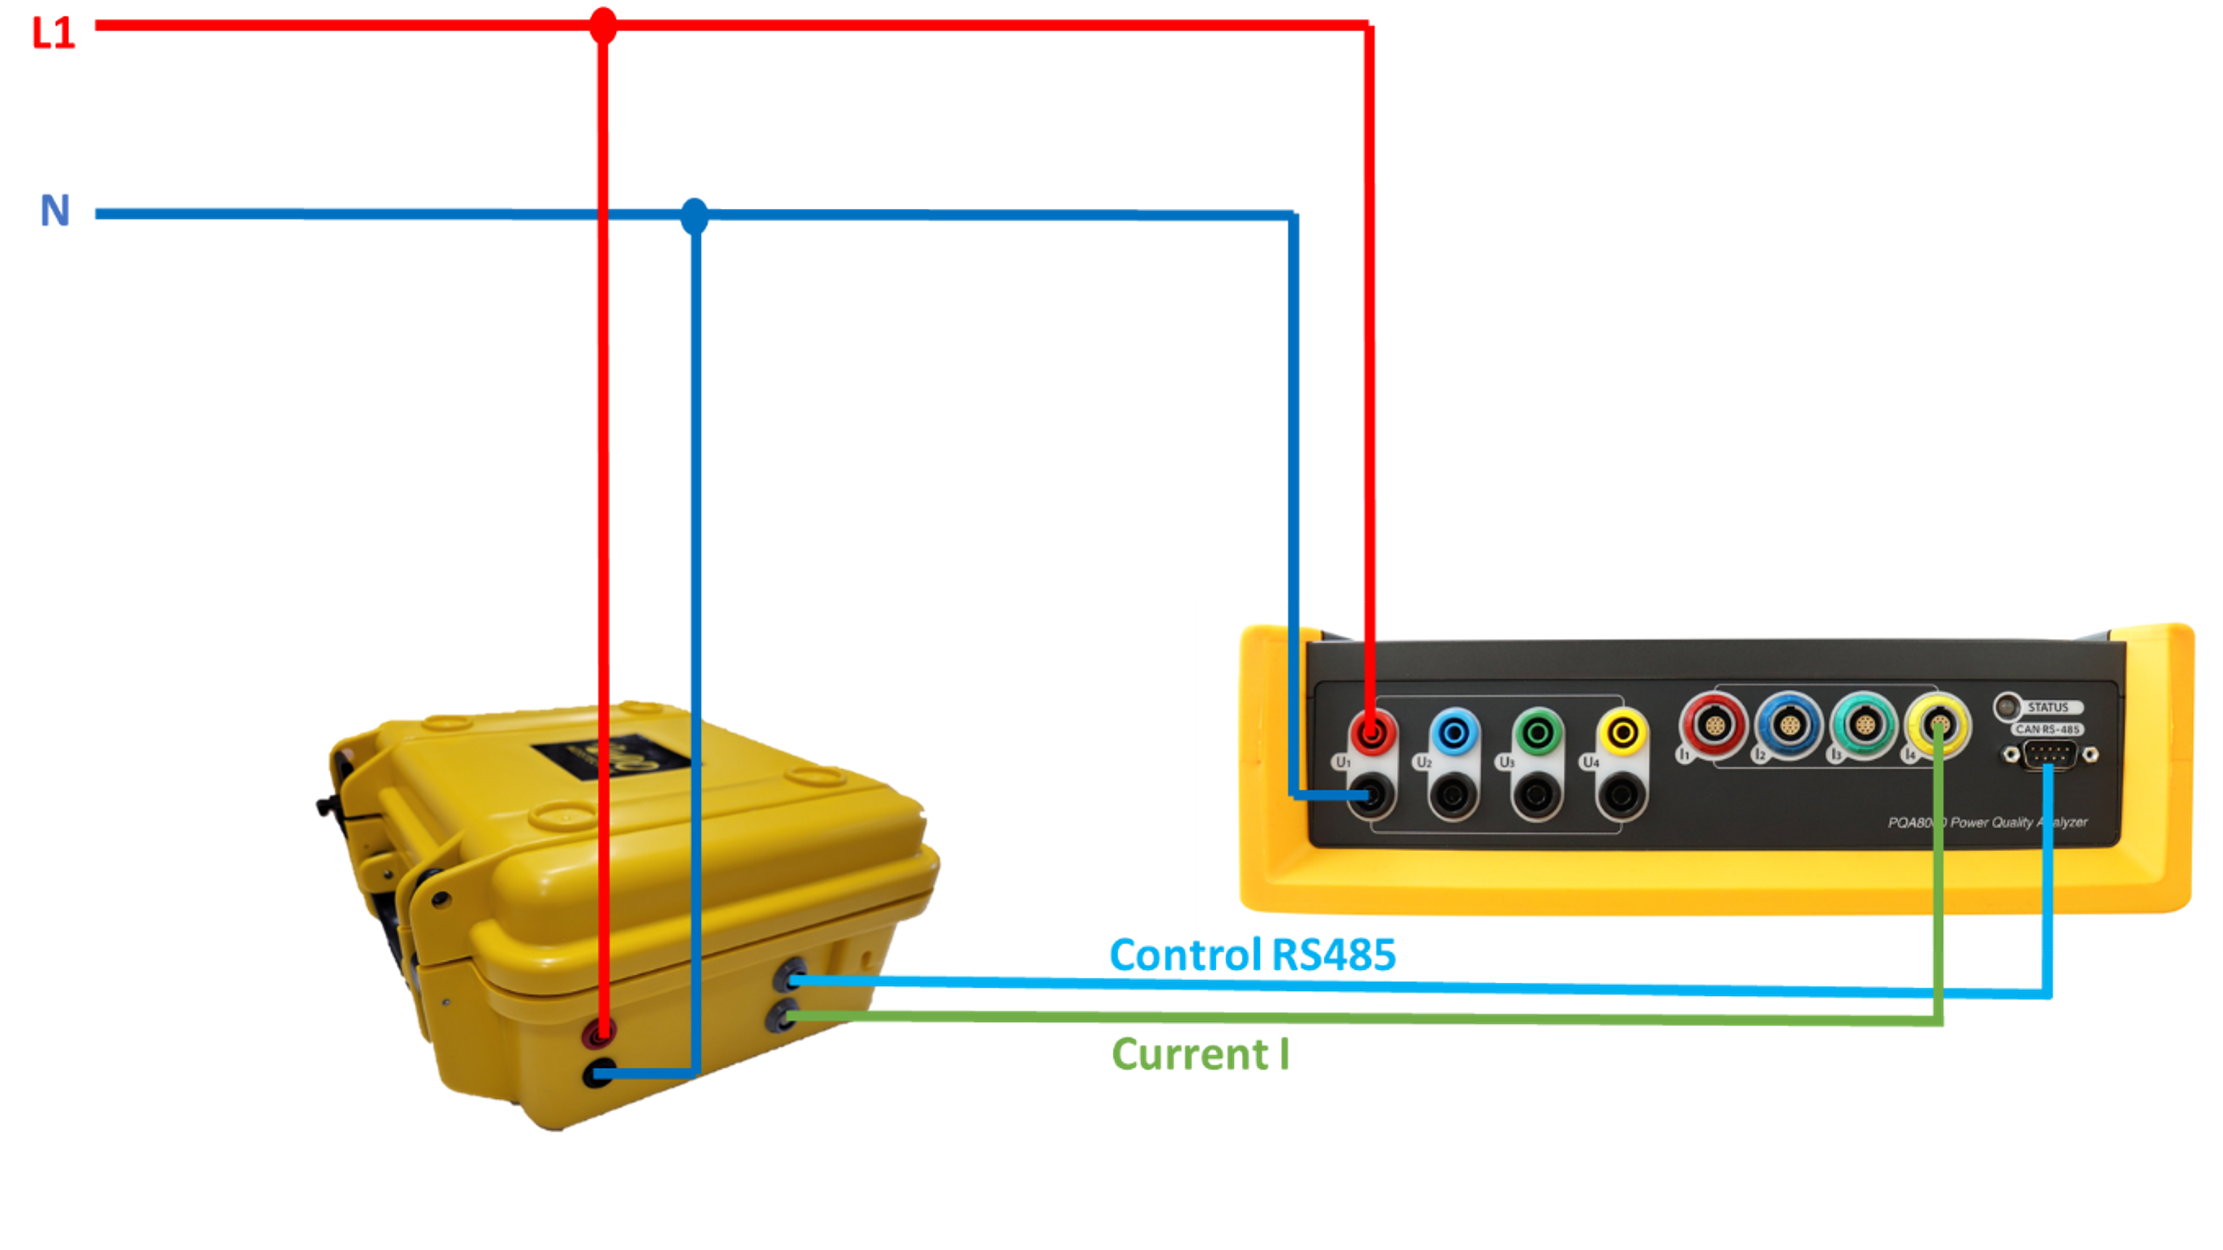
The Grid Impedance Analyzer GIA allows measuring the single-phase grid impedance (phase to ground or phase to phase) in a frequency range up to 450 kHz. The instrument is used together with the PQA8000H instrument.
The Grid Impedance Analyzer GIA allows measuring the single-phase grid impedance (phase to ground or phase to phase) in a frequency range up to 450 kHz. The instrument is used together with the PQA8000H instrument.
The high penetration of distributed generation and modern electrical devices based on active power electronics are causing significant changes in the higher frequency grid impedance. The additional inductances and capacitances (LCL Fi lter, DC link etc.) causes multiple parallel and series resonances. Effects are high harmonic currents, high harmonic voltages, overheating of devices, noise, additional losses or malfunction of equipment or malfunction of digital communication.
Grid codes (for example DACH-CZ, TOR, TAR) first time allow the consideration of resonance factors for the determination of harmonic emission limits for each individual harmonic.
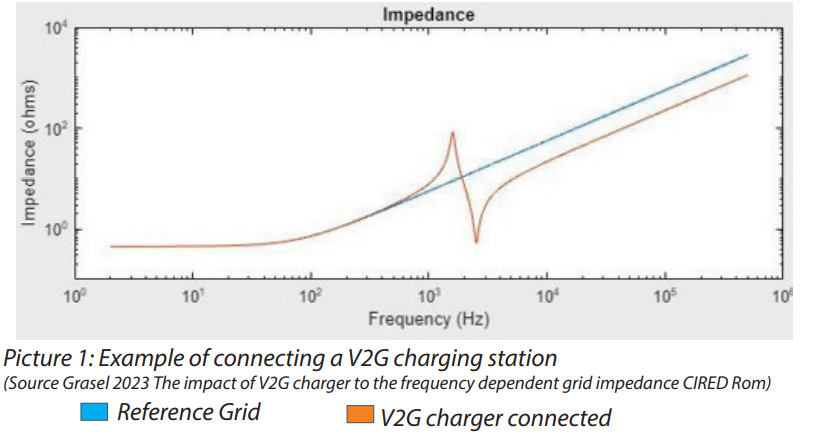
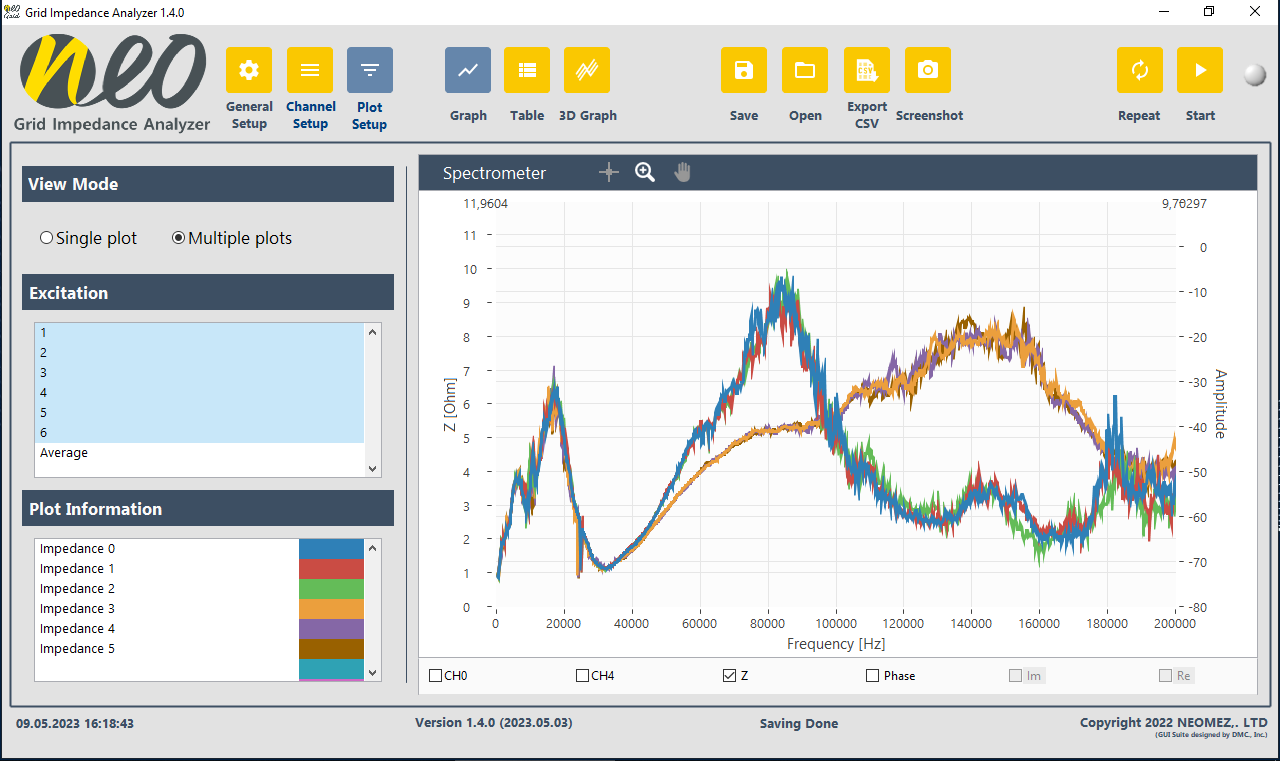
The picture above shows how resonance points appear while connecting a V2G charging station. Note: Even if the charging station is not in operation, resonance points are caused due to the LCL input filter.
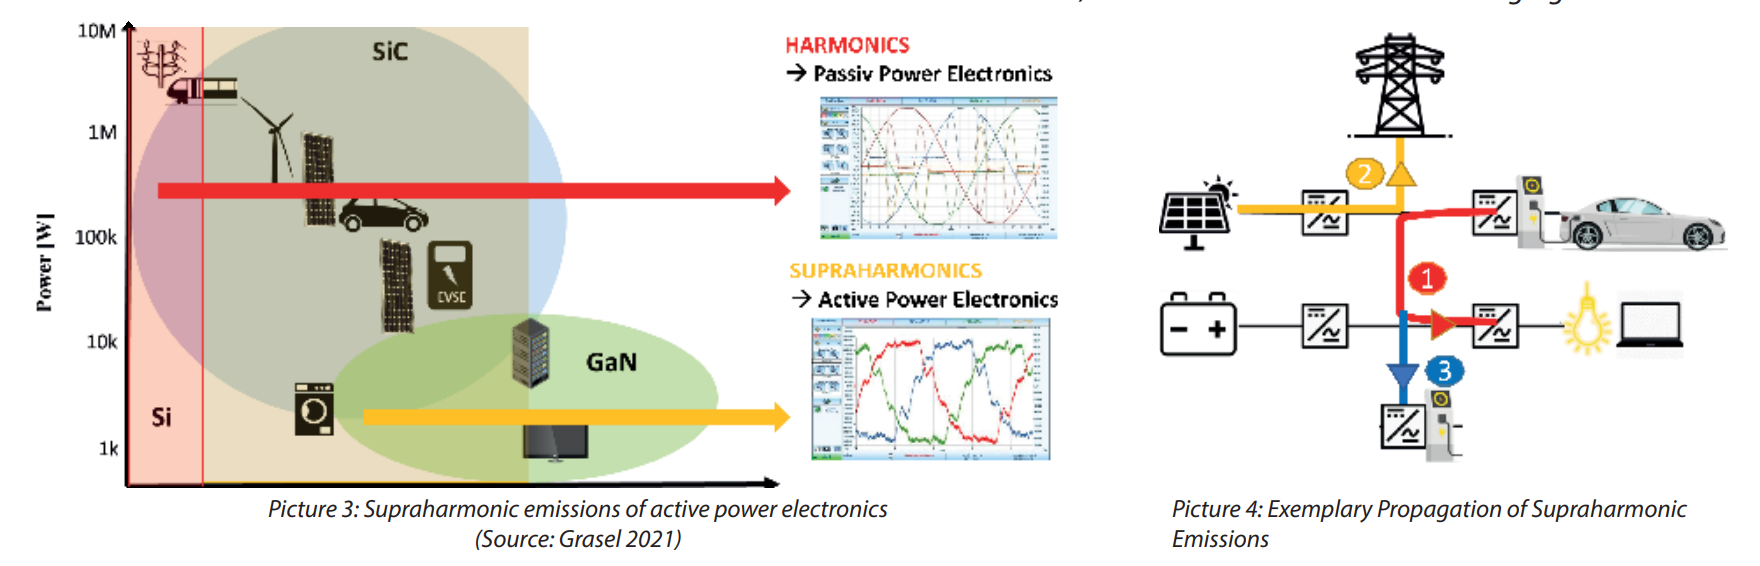
Supraharmonic emissions in the range of 10 kHz to 500 kHz due to active power electronics such as Photovoltaics, Electric vehicle chargers, Wind power, heatpump and others
Propagation of Supraharmonics Examples
Case 1) within a customer facility
Case 2) to transformer station (e.g. up to 16 km)
Case 3) to non-active electric vehicle charging station
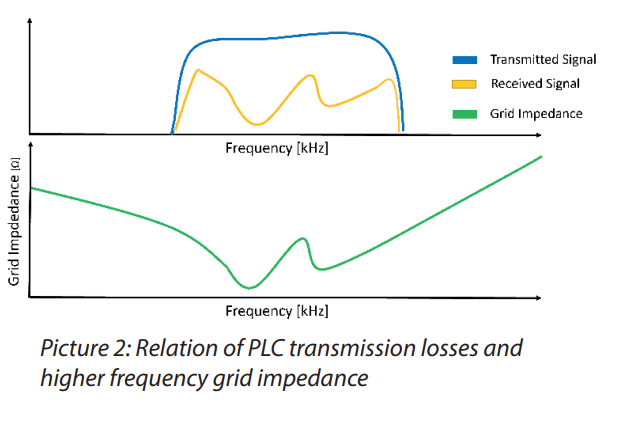
Power Line Communication (PLC) is often used for smart metering applications in a frequency range from 10 kHz to 450 kHz (CENELEC A, B, C, D, FCC, ARIB). Existing power cables are used for communication but represent a “rough” medium. Communication failures are the consequence:
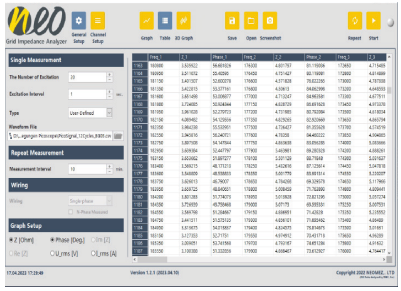
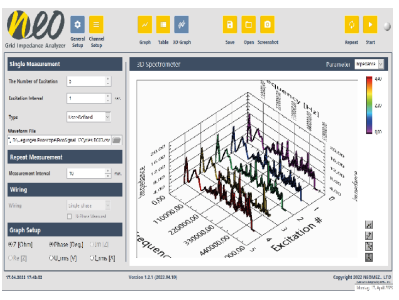
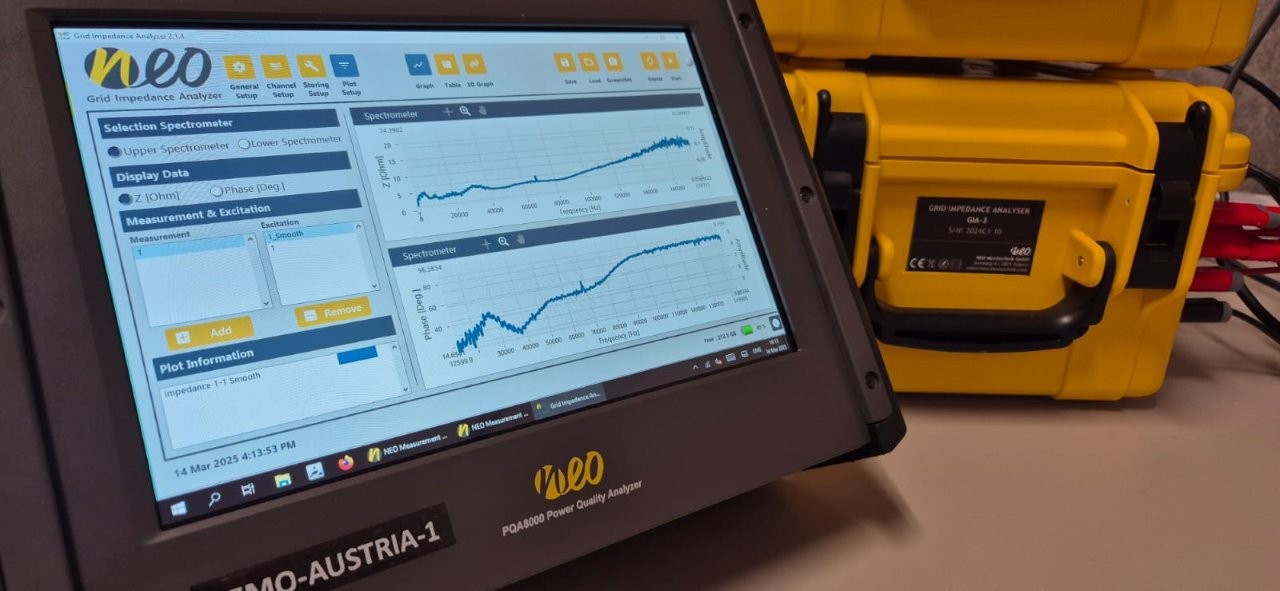
For easy illustration of the time- and frequency-dependent characterisation of the mains impedance (grid impedance) of the low-voltage electrical grid, the GIA offers table views, 3D views and spectrometer views.
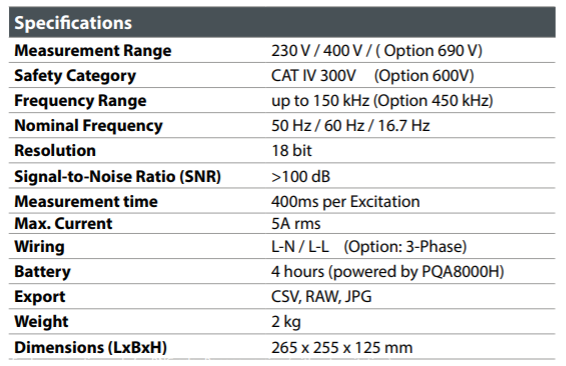

Analysing the effects of Supraharmonics asks for Power Quality Analyzer that cover a frequency range up to 500 kHz. Classical PQ Analyzers present problems because of their limited bandwidth. Typically they can measure up to the 50th Harmonics (2.5kHz), but cannot detect higher emissions of voltage and currents. By design, they are not able to be used in the troubleshooting process at all.
In this Application Note, we outline the complexity and shortcomings of traditional measurement approaches we often see out in the field. Fortunately, all these problems do not concern engineers with the appropriate measurement equipment. Our customers appreciate the PQA8000H in troubleshooting Supraharmonic emissions, where its strengths really come into play ..